 |
TWO PATHS DIVERGED IN A YELLOW WOOD... |
Following a stellar September, I believe the stars are now lining up powerfully to halt the progress markets have made since Ben 'The Beard' Bernanke placed his quivering finger over that nuclear button marked 'QE2'...
We are now about to watch a classic battle play out between irresistable force and immoveable object, between the mighty US Federal Reserve and cold hard economic reality. Which will win?
Most of the world's investors appear to be lining up on the side of General Bernanke. They've rediscovered the oldest adage on Wall St - 'Don't Fight the Fed' - finding true religion in his promise to reflate the economy and lift asset prices at almost any cost. He will reveal the true size of his army at the next Fed meeting on November 3rd. Meanwhile...
WHO'S BEEN READING
ON THE MONEY?
(If image does not display, click here)
The most relevant section begins around 6m:30s.
If, however, you want a fascinating insight into how the very best
investors and traders think, the whole thing is a must-watch.
investors and traders think, the whole thing is a must-watch.
The D.F.F. argument was made most recently and compellingly in a now-famous interview on CNBC with David Tepper, one of the world's most revered and successful hedge fund managers. Here it is for anyone who's not yet seen it.
(Just for the record, a couple of weeks before his interview I brought up the exact same argument to justify the ramp in stocks. I never knew I was being followed in such high places. Great to have you on board, David ;-))
As you watch, listen out for the one throwaway phrase Tepper uses to qualify his bullish view, a phrase few commentators picked up on. He says that, if the Fed does push the QE2 button, everything will rally "in the near term".
Now - the Fed started to encourage market speculation about quantitative easing back in July and Bernanke telegraphed his intentions to markets strongly at the end of August. So we have essentially had 6-12 weeks of price gains on little real economic improvement, merely the promise of a Fed steroid booster injection on November 3rd. Elsewhere in the interview Tepper classifies 'the near term' as a 3 month time window - which would imply that, with the substantial rally we've already enjoyed, this push higher in stocks may in fact be almost done.
AIN'T NUTHIN' GOIN' ON BUT THE
BUCK
BUCK
What's clear is how much of this sudden surge in prices is a result of the sharp move down in the US dollar. We're seeing the old-fashioned carry trade on steroids: major traders sell the dollar short on margin (bet on it to fall with borrowed money) and as it falls use that money to invest in risk assets all over the world, especially stocks, currencies and commodities.
Everything is fine as long as the buck either falls or stays steady, but if it starts rising strongly these traders have to quickly sell what they bought in order to pay back their borrowings or they're screwed.
This exact same process took place in early 2009 when the Fed began its first QE experiment. Since then, the correlation between falls in the dollar and rises in stock prices has been so tight it's almost embarassing.
 |
| The inverse correlation between the dollar and the stock market. When the buck (green) is in a sharply falling trend (white boxes) it's time to be in stocks. When the dollar shoots higher - time to get outta Dodge. |
And plainly the tail is not wagging the dog here - it's not that rises in the market cause a fall in the dollar, but that dollar weakness fuels a rally in stock prices. Partly, multi-national companies benefit from a falling currency when they repatriate their profits from abroad; principally though, what we're seeing is traders in large institutions using a depreciating dollar as a tool to bid up stock prices.
(The subject of the Fed's meddling in markets and its treacherous consequences is a touchy one and liable to send me off on a whole other tangent, so I'm putting together some thoughts on this in a separate post, coming soon.)
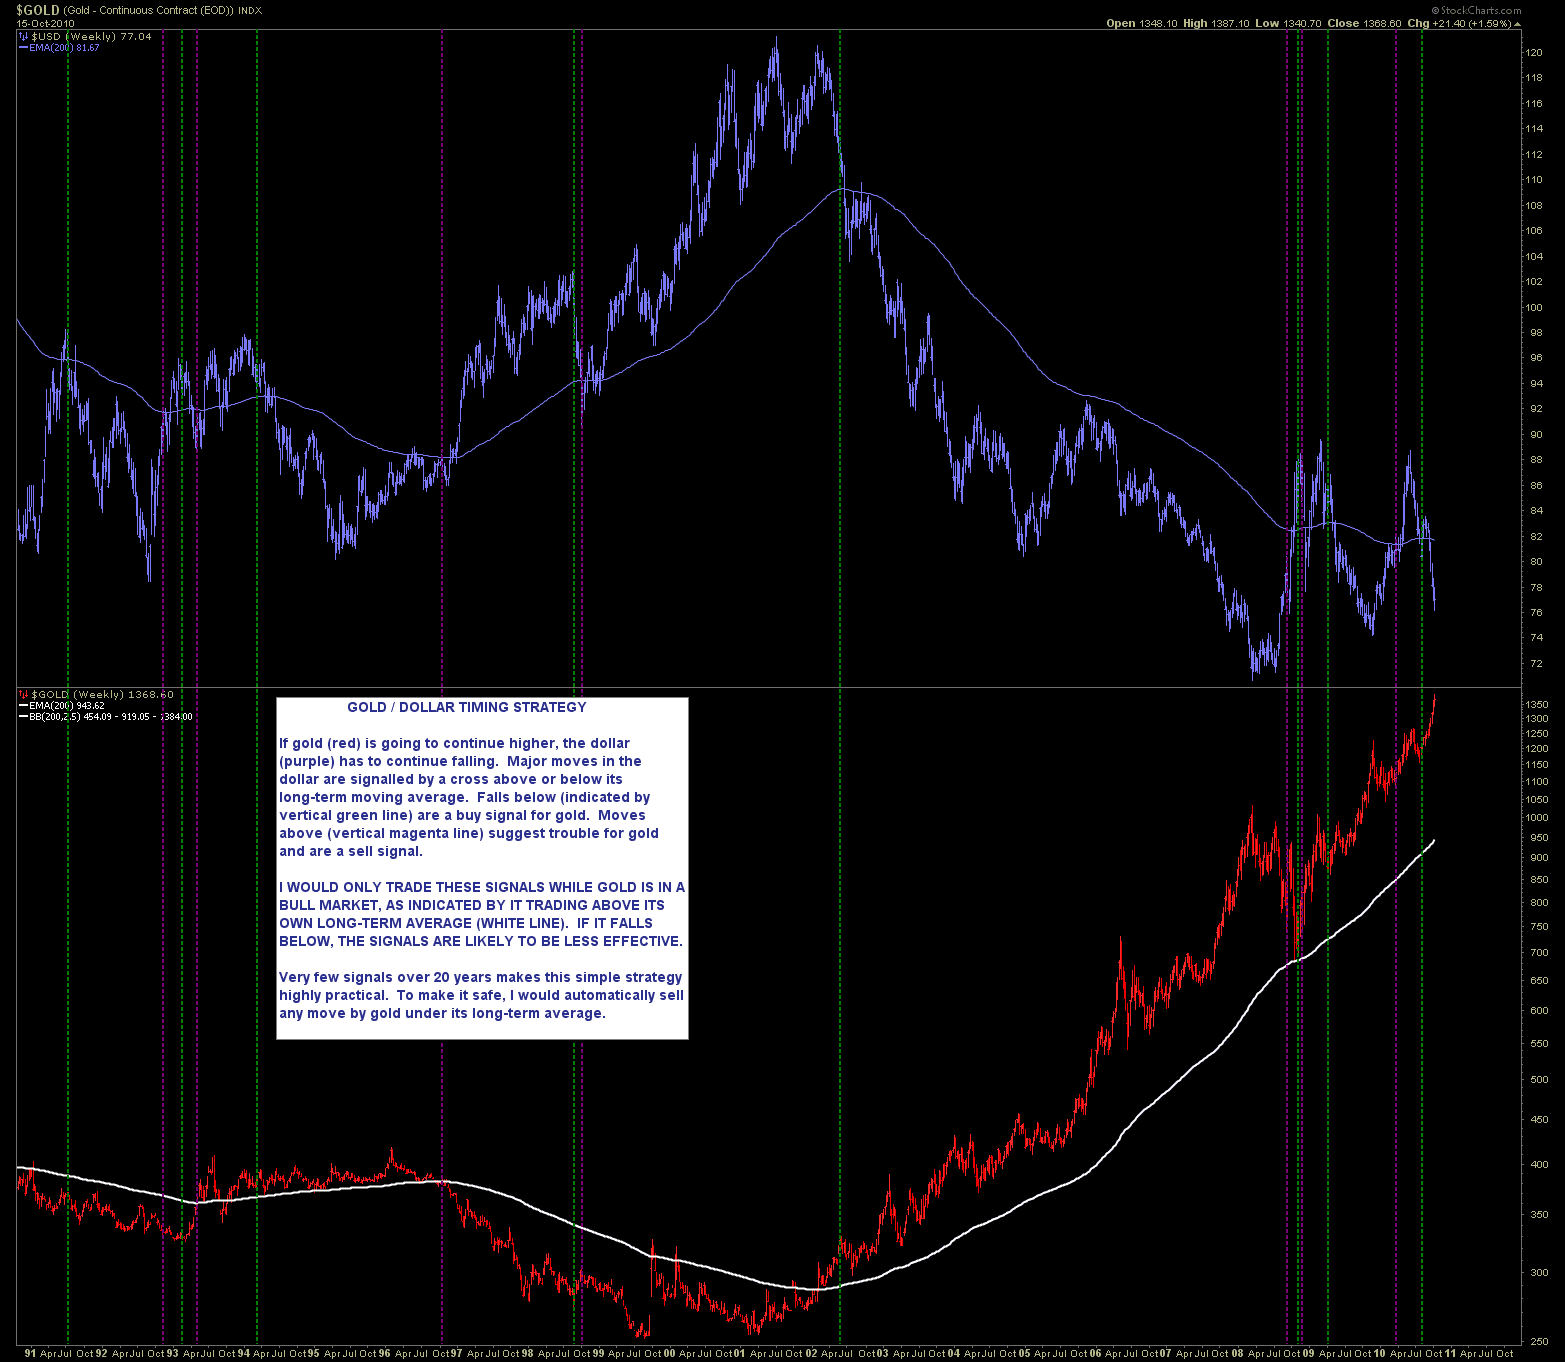
DOLLAR PLUNGE NEARS A BOTTOM
So here's the ultimate contrarian question: what if the common assumptions of the market at this point are quite simply wrong? What if, confounding mass sentiment among market participants, the US dollar does not fall further? Indeed, what if it is about to stage a long term push higher?
What if, as a logical extension, gold and precious metals are now set to face lasting dollar strength? Unless their cast-iron relationship to the buck miraculously disintegrates, a peak in price around these levels could occur, could it not?
What if stocks and commodities have, after a 10%+ rally in six weeks, already priced in the initial impact of Fed policy and, with the economy faltering and the dollar rallying, are ready to stall and fall back?
This is a highly contrarian play which flies in the face of received wisdom about various political and economic 'certainties'; and in the end, it all comes down to the outlook for the dollar:
 |
| US dollar since 2008 - forget the wailing of gold bugs and inflation hawks bemoaning the certain death of the dollar - LOOK AT THE CHART. Is the long term trend rising or falling? |
Looking at both the pure price action and at the sentiment picture, the case for a medium-term low in the dollar is absolutely compelling.
Just 3% of the trading public surveyed in the Daily Sentiment Index believe the dollar will rise - about as low as the index ever gets. 97% are betting on a falling dollar. Folks, that means there's almost no-one left to sell. And when a few brave souls with a bit of cash behind them decide it's time to shout 'the emperor has no clothes' and buy the dollar, it will rally and rally hard, just as it did when sentiment hit a similar extreme in late 2009. (Stop Press: The dollar is forming a base today, Monday 18th October, and appears to be quietly strengthening.)
This is one of those times when one just has to block out the bellowing chorus of majority opinion and the TV talking heads and focus on facts: what is the price action saying?
Because unless and until the dollar makes a sustained break below its rising trendline from 2008 there is no dollar meltdown - in fact the percentages technically now call strongly for a rising dollar. What's interesting is that this is not the only evidence for a turnaround: multiple price and sentiment clues elsewhere fit this contrary picture.
COMMODITIES SENTIMENT SHOWS
EXTREME BULLISHNESS
 |
| Large speculators have piled in like this only rarely - and the results ain't pretty |
Below are the two previous peaks in trader euphoria shown above - January 1996 and February 2008 - in slightly closer detail. The peak in price was not immediate, but was a bell-ringing top when it finally showed. Both occured within three months of the inital signal (the current extreme was hit one month ago). And both turning points followed a long term low in the US dollar.
 |
| The only piece required to complete the puzzle is a low in the US dollar (blue) |
GOLD AND SILVER IN LA-LA LAND
As mentioned in several previous posts, the precious metals have entered proper bubble territory and the only question worth answering is when they pop. Sure, we don't want to exit early and miss all the fun but nor would it be smart to stay at this particular high-stakes party a moment too long.
What one cannot afford to forget is that, at the latter stages of every bubble there's ever been, everyone believes prices have further to rise. Remember UK house prices in 2007? Remember internet stocks in 2000? That is why the bubble must pop - because eventually everyone's in and there's no 'greater fool' to buy at whatever ridiculous price has been reached.
I'm not at all sure the metals have yet hit that kind of insane level, although let's be clear: there is no guarantee that the price has to become insane. And as gold has more than quintupled in price since the 'Brown Bottom' (when our dear Gordon sold the UK reserves) one could say gold is quite entitled to top right here and now.
 |
| After the dollar's previous low in December '09 gold (red) pulled back immediately then trod water while the dollar rose; it only began its recent breakout once the buck began to fall in July |
 Meanwhile it's dowdy cousin silver recently broke to a 30-year high whilst recording a reading of 95% bulls on the Daily Sentiment Index, a level which has signalled several prior peaks. I suspect what is happening here is that new retail buyers (ie. the general public) are entering the market as they see silver's relentless rise, making the 95% level less effective in the short run. Undeterred, intrepid blogger Babak over at Trader's Narrative has charted peaks in two different measures of momentum on silver (the Relative Strength Index, plus silver's percentage distance above its own 200-day moving average.) When both are this extreme, a pullback has followed every time.
 |
| We're almost certain to see a correction - we just don't know how big |
And by the way, in case you don't think precious metals are in a bubble, let me introduce you to Mr T. That's right, Mr T of the A-Team is now officially promoting pawn shops...
You know it's a bubble when Mr T is on Bloomberg
STOCKS - PUBLIC SENTIMENT
REACHES A SIGNIFICANT EXTREME
One of the very best measures of extreme sentiment among the share-buying public comes from the American Association of Individual Investors, who have been polling their members about their investment decisions since the 1980s. These surveys have proven time and again to be a superb contrarian indicator, ie. when Joe and Jane Shmo are overly optimistic and keen to buy, it is usually a heaven-sent sign to get out of the stock market.
The survey calculates the ratio of the number of bulls to the number of bears, with 0.5 being neutral. To smooth out the peaks and troughs, Sentimentrader posts a 4-week moving average of this survey and adjusts for very long term trending effects. Here is the latest chart:
 |
| Relative to its recent range, the AAII 4-week ratio of bulls to bears has shifted decisively to the bullish camp. This is a classic contrary siren sound: beware of stocks! |
The last time we were at these levels was in May 2008 - not a good time to be a bull. In fact in no case since 2000 has a touch of the upper band shown here not resulted in a significant correction.
 Many other measures of sentiment are at or approaching extreme territory, another highly reliable one being commercial hedgers in the Nasdaq 100 index. These are traders who have direct interests in the companies listed in the index - they're the 'smart' money. And, as insurance to protect their interests, they just made a huge bet on a fall in the Nasdaq 100. This chart shows what happened to the Nasdaq 100 on each previous occasion since 2004 they went anywhere close to being this short.
 Other related indicators have increasingly begun to flash red in recent days. But there's more. Separate back up for the idea that little or no further progress in stocks will now be made comes from some good old friends...
HISTORICAL PARALLELS POINT TO
AN IMMINENT REVERSAL
Yes I'm wheeling them out again, my amazing historical parallels from yester-year. I've written extensively since March about the truly historic momentum which charaterized our run up in stocks from March '09 - matched only seven times in the past 90 years according to a standard measure of momentum known as the Rate of Change.
To understand the huge significance of these precedents as they relate to our present pickle, please check out the link above; suffice it to say, they suggest unequivocally that in the short term at least, we're likely at the limit of any move higher.
The dates of previous momentum extremes were, 1929, 1933, 1937, 1939, 1983, 1987 and 1999, and I undertook a Fibonacci analysis of each back in July.
 |
| 1983 - click to enlarge |
 |
| 1933 - click to enlarge |
If these two precedents continue to hold, however, the current recovery from the July lows will not reach the April high for several months yet. Here is what happened in 1934/1984, drawing Fibonacci retracement lines between the initial high and subsequent low in each case.
CLOSE-UP 1934
 |
Stocks bottom in October, peak at 76.4% (early Dec.), droop down to test the 38.2% level (late Dec.), surge up to test the highs - then fail... |
From a low in October, stocks rallied then peaked at a 76.4% retracement of their move down from July; they then pulled back to test the 38.2% line in early December. By late that month however they had recovered strongly to test the July peak.
CLOSE-UP 1984
 |
Stocks bottom in July, peak at 76.4% (early August), droop down to test the 38.2% level (Oct.), surge up to test the highs - then fail... then break out higher! |
The same basic pattern played out in 1984. A low was formed in July, stocks pushed up to the 76.4% retracement line by August, pulled back to test the 38.2% line for several months then forged right on up to the old highs.
We can now rule out 1929 and 1987 as valid comparables as neither recovered from their initial breakdown in the way we have done, both going on to crash spectacularly. Still, we can't assume we're out of the woods yet: in the the 1937 example, a similar rise to the 76.4% Fibonacci retracement marked a major top - stocks then skidded lower, shot through the 38.2% level without passing go or collecting £200 and accelerated into a hideous 52% decline.
CLOSE-UP 1937
 |
A low in June led to a strong push higher into August, hitting the 76.4% Fib level... and that's all she wrote; next stop, recession & war. |
I'm inclined to conclude from these precedents that - when considered in conjunction with all the other evidence presented here - we are very likely to see a pullback to the 38.2% retracement level - 1090 - in the S&P500 index. Expect almost all world indices to follow suit. It's conceivable that the S&P will only fall as far as the 50% retracement at 1115, but I'm inclined to think that dip too modest to fully shake out the current overly-bullish sentiment.
The key will be to watch for a low at that point - 1115 or, more likely, 1090. If stocks can hold there and reverse, we will likely be beginning an attempt to recapture the April 2010 highs by early 2011.
If stocks cannot hold 1090 in the S&P500, it will be time to become more aggressively negative, as a much more worrying scenario may then be opening up. Once again, folks, here's the deal:
CONCLUSION
The message is clear: contingent upon a low being formed in the US dollar, risk assets including stocks, commodities and precious metals are now set to stage a reversal.
The dollar is today showing signs of strength. It appears the correction is about to begin - the only question is whether it merely represents a pause in the uptrend or the start of something more ominous.
When considering how to invest I generally look for solid technical signals - I don't trust hunches, take tips or rely on woolly and often subjective fundamental analysis. Here we have a very clear technical and sentiment landscape which takes a deeply contrary position to the general market view. These are the times when serious money can be made and risk is low, since everyone else is on the other side of the trade and prices are skewed to an extreme.
Clearly, however, a succesful long term trade here would depend on a lasting low being formed in the dollar. (Short term, I think a modest correction is pretty much baked into the cake). If we are looking at a long term dollar low, I suspect the bottoming process may take several months, allowing another push higher to take place in asset prices.
It is also possible that Bernanke will jump wildly over the cliff-edge in his quantitative easing announcement on November 3rd, spewing $trillions into the system and provoking a total breakdown in the dollar. Should that occur, all bets will be off. Given what one can glean from his careful statements and speeches, however, this scenario seems unlikely.
Neither can one rule out the possibility that a shock event, such as a banking or sovereign debt scare, will overwhelm all Bernanke's best efforts and begin this crisis' second wave, as I've been anticipating in these pages for so many months.
And so, on we march towards 2011 - with its promise of a possible second recession, the prospective failure of Bernanke's QE2 experiment, an increasingly probable second leg down in the US housing market, a coming property implosion in China and sovereign debt turmoil among the Eurozone PIIGS (possibly even - God help us - in Japan). For a long term investor, you've got better odds of survival doing twenty lengths in a shark tank. For a trader, it's all your Christmases come at once.
Hope for the best, friends; prepare for the worst!