
In August's On the Money post I outlined in broad terms a strategy which, if a century of data can be trusted, should allow anyone serious about their pension or investments to build up a very handsome return over time.
Devised by Mebane Faber of Cambria Investment Management and originally published in a 2006 working paper entitled 'A quantitative approach to tactical asset allocation', it combines two of the very few approches to long-term investing which have clearly been shown to work: diversification and trend-following.
Despite its disarming simplicity of both conception and operation, I've decided to use it as the backbone of my long-term investment plan. Perhaps I'm a simple kinda guy. Or perhaps, because its returns have exceeded those of many more complex strategies (not to mention buy-and-hold) with far lower volatility and negligable drawdowns, it's a no-brainer.
In any case, I promised I would update with a few essential tweaks to take account of two modest but significant weaknesses in the strategy I've been able to identify:
- Diversification has become less effective since the financial crisis as most asset classes have become unusually correlated
- The secular (ultra-long term) trend may have turned down - which makes the timing system used vulnerable to sudden shocks
The diversification question is one which deserves more detailed research so I'll update in a later post, but I thought this would be a good opportunity to nail the timing issue since, as you can see from the chart above, the system recently gave an enticing BUY signal. Should we take it?
APRIL TOP, SOLID AS A ROC
In a post in March this year, I suggested that we may finally be approaching the end of this fairytale rally. I had been stunned to see a chart of the Dow Jones Industrials Average, going right back to the 1920s, with a 10-month Rate Of Change indicator overlaid. So glaring were its insights, I called it the Chart of the Century:

Dow Industrials Average 1977 - Feb 2010 &
peaks in the Rate of Change
peaks in the Rate of Change
Prior to 1982, the incredible momentum we've recently seen has only occured in one other period - the Depression era.

Dow Industrials Average 1920 - 1946 &
peaks in the Rate of Change
peaks in the Rate of Change
Each previous time stocks had powered to this momentum extreme in the past 90 years (there were seven discreet occasions) it marked, at the very least, an eighteen-month consolidation phase during which stocks could make no further progress; on no fewer than five of those occasions, a major collapse in stock prices soon followed.
Even though there are only a small number of instances to go on, the consistency of outcome is telling. It simply seems that there is a natural limit to how much frenzied buying traders can do before sellers step in and restore balance.
Even the greatest ever buying stampedes - the lead up to the 1929 Wall St Crash, the 1932 recovery (a 100% rally in three months, eclipsing our paltry 75% jog higher), the 1999 dot-com mania - all these stumbled, paused or crashed soon after hitting a momentum wall, the 45% handle on a 10-month Rate Of Change indicator.
Apart from the nasty 'stagflation' era of the 1970s, those few periods highlighted by this simple indicator were the very worst in a hundred years of market history.
Yet the 1970s were actually a very good decade for the Long Term Investment Strategy I outlined last month. While annualized overall returns for a buy-and-hold investor were just 5.8%, the timing strategy kept you out of the worst periods and kept you in during the upswings, returning an annualized 8.4% (a 44% boost to your investment, pension or retirement plan).
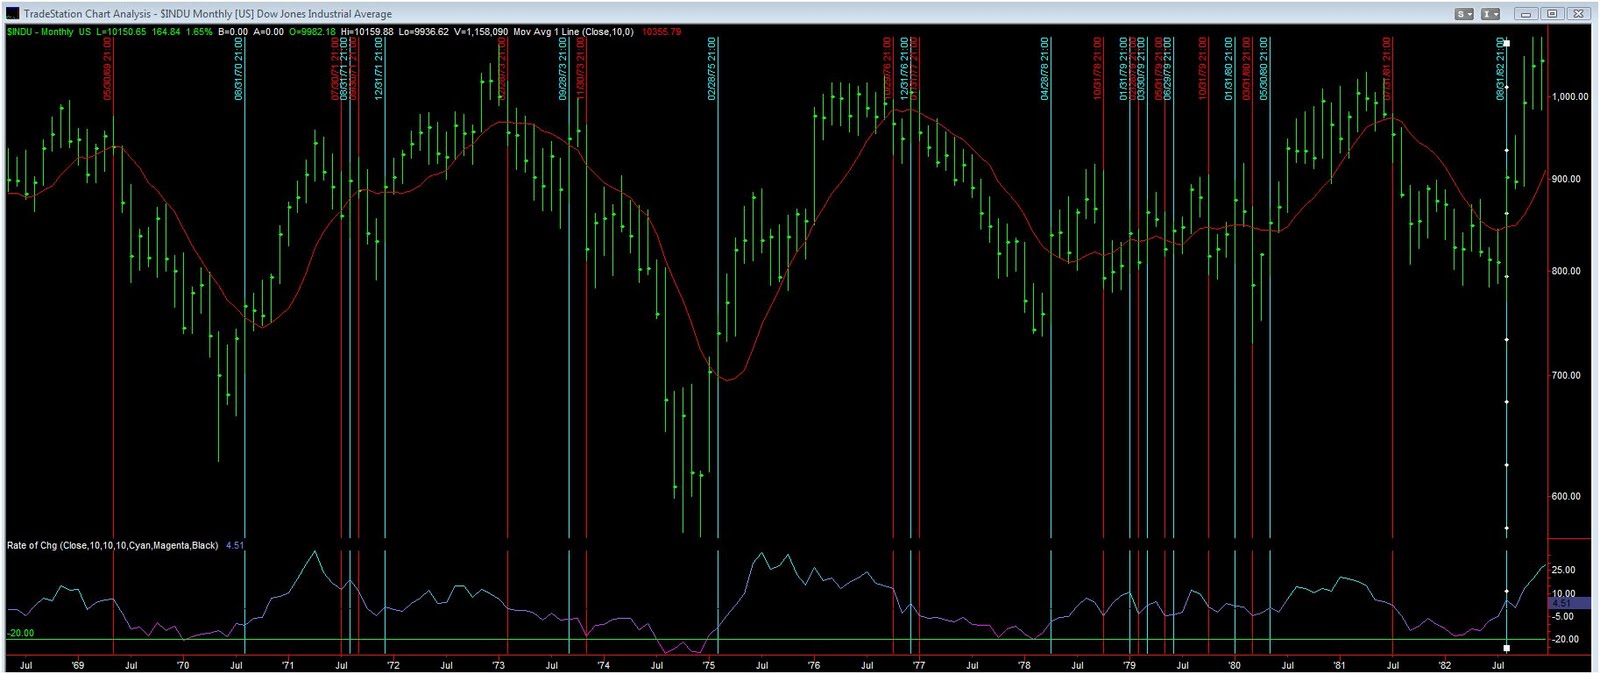 |
| Strategy signals during the 1970s. It looks busy, but 26 calls to your broker over 13 years would have added almost 50% to your stock market returns. |
The Depression decade of the 1930s was less impressive, however. Although it still beat 'buy-and-hold' (3.1% annualized gains versus losses of 0.5%), the strategy suffered some big drawdowns despite avoiding the catastrophic bear market of 1929 - 32. It got caught out a couple of times in 1939 and 1940 by sudden bursts of volatility which the 10-month moving average was too slow to alert to.
The same problem occured in 1987. To be fair, very few timing strategies can claim to have avoided the '87 crash (20% wipeout in one day, 40% in total) but the system was caught badly flat-footed in Black Monday's stampede for the exits.
And in 2000, as the market was staggering around at the height of the boom, investors in stocks would have been constantly whipped back and forth across the system's buy/sell signal line and suffered some frustrating losses in the process.
 |
| Strategy signals in 2000 - a whipsaw ride to hell. But read on, pilgrim... |
If you had somehow managed to avoid being in the market during these extremely rare and highly volatile periods, you would have avoided every single long-term downturn of the past 100 years! Fortunately these periods are not difficult to identify.
Unfortunately we're in one right now.
What I'll illustrate here is a simple and straightforward way to time one's exits and entries to take account of the unusual conditions, a method which, while nothing can ever be guaranteed, should keep us out of trouble and in the money as we tiptoe lightly forward.
 |
| Our situation as of August 28th 2010 - the Dow exceeded ROC 45 in December 2009 |
__________o0o_________
STEP 1: IDENTIFY A MAJOR MOMENTUM TOP
That's embarrassingly easy. Aside from a 10-month Simple Moving Average line overlaid on the price, you'll need to put just one indicator on your monthly chart, a 10-period Rate of Change. There's no substitute and there's no need for one. This most basic of indicators is available on every serious charting website or package.* If yours doesn't offer a ROC indicator, move to one that does.
- When the indicator reaches 45, you'll know a market top is approaching.
Setting the warning level of this indicator at 45 will identify only the most extreme market peaks**. It will not help you during less volatile periods, such as we saw between 1942 and 1982 (so you could go an entire investing lifetime and never need worry). But the timing strategy itself is perfectly suited to such non-extreme environments, with the 10-month moving average getting you in or out of your positions as markets gently roll over or begin steady moves higher.
The trouble arises when markets make sudden moves because the market is massively over-extended - which is the position we've been in since December '09.
*Free charting websites, where you can easily set up the indicators needed to follow the system, include Stockcharts.com, freestockcharts.com and bigcharts.com.
**Most often, momentum backs off once it reaches 45 on the Rate of Change. But just occasionally the buying is so strong that readings keep pushing up over that level, as we saw in 1933/34. If it does, and you've already sold using the strategy I'm about to describe, simply re-buy until the momentum finally drops below 45; then follow the same steps over again. See the example from 1934 below.
STEP 2: GET OUT NEAR THE TOP
It's straightforward: you just need to use a methodical, disciplined approach. Here's the one I'm using:
1. Identify a two-month low.
This where the lowest price at any time during the current month is lower than any price during this or the previous month.
2. That low becomes your sell signal.
On the last day of each month, check to see if there's been a two-month low. If there has that price is now your trigger to exit the market. From now on you need to check your chart once a day. Should prices fall below the prior month's low at any stage, exit immediately - that very day if possible - as there is a heightened risk of a major crash developing in such circumstances.
However, if the market moves up during the current month and does not at any stage drop to the prior month's low...
3. Your sell signal moves higher, resetting to the most recent monthly low.
So for instance if the initial two-month low was in January at 1000, but February moved higher and the lowest price hit was 1100, on March 1st your exit trigger would move up to 1100. Simple.
This process continues as the market pushes higher. Thus, with each month that the market moves up you capture more of any subsequent gains but are protected if the market begins to weaken.
Eventually prices will stall and drop below your trigger point. The moment they do so you sell. You don't wait until the end of the month - by then it may be too late. Sell immediately.
Sometimes this method will get you out right at the peak, other times the market pushes a little higher before rolling over. Let's look at some real-world examples.
1987

Prices raced higher through 1987 until rising interest rates put the wind up markets and vertigo set in. Having hit 45 in July, the momentum stalled as prices edged up. During September a two-month low was printed at 2468 (ie. it was the lowest price anytime in August or September). You would use this as your initial exit trigger - falling below it during the following month would be a sell signal. Prices began to fall again in early October, finally breaking through that September low on Oct. 12th. You had four days to get out.
On 19th, Black Monday, the market crashed 20%.
1934

This was unusual in that momentum kept surging higher after hitting 45 for the first time - not surprising given the depth of the preceding collapse. After the initial reading in April 1933, stocks pushed up strongly until a two-month low was registered in July. But simultaneously, the Rate of Change climbed back over 45, suggesting a powerful move which was not yet done.
In this circumstance you would hold off selling until momentum finally showed signs of abating - and 45 was finally breached to the downside the following February. Next month a new two-month low was set, and that sell signal was triggered in May.
1937

Once a two-month low had been set in April 1936 the market kept on pushing higher. You would have waited patiently, resetting your exit trigger with each month's higher low, until the market finally broke down in March of 1937.
1939

In January 1939, as the Rate of Change hit 45, prices also dropped to a two-month low at 136. This level was now your exit trigger. But in February the market recovered, the lowest price recorded was 142 and no exit was signalled. Once you made it into March, February's low of 142 became your new exit trigger. It was breached on March 20th.
Within two weeks the Dow had dropped another 15%.
Now take another look at the right hand side of that chart. By one year later, the index had struggled back to its previous highs - only to collapse once again in a terrifying 25% plunge during May 1940. Following the timing strategy in its original form would have meant you buying a cross above the 10-month average in September 1939 and going down in flames along with that crash.
The final tweak I've come up with keeps you out of the market altogether until the stormy conditions which create these wild swings have passed.
STEP 3: ONCE YOU'VE SOLD,
DO NOT RE-ENTER UNTIL THE ALL-CLEAR IS GIVEN
Once the Rate of Change indicator hits 45 and you have sold as per the above instructions, the original 10-month moving average strategy becomes inactive and you stay out of the market entirely.
The strategy only becomes active again once you receive the ALL-CLEAR.
There are two ways that the all-clear can be given. Once you have sold and the anticipated market decline has begun, stocks must show either extreme strength by reversing upward and breaking out through the highs, or must show extreme weakness by breaking down, resulting in capitulation and selling exhaustion. Here are the simple rules:
- The market recovers and makes a monthly CLOSE above the highest price reached since the Rate Of Change indicator hit 45, OR:
- The market breaks down strongly, pushing the R.O.C. to -20 or below.
Once one of these conditions has been fulfilled, the all-clear is sounded. Illustrated examples to follow.
STEP 4: ONCE THE ALL-CLEAR IS GIVEN,
NORMAL STRATEGY RULES APPLY ONCE AGAIN
The all-clear simply means that you revert to normal rules. In other words, you go back to a strategy of buying a close above the 10-month moving average and selling a close below it.
Here's how the whole thing looks in practice:
1929

You would have sold five months before the peak and suffered an anxious wait, but eventually the market succumbed to gravity in spectacular fashion. The Wall St Crash in late 1929 pushed the Rate of Change indicator down below -20, which sounded the all-clear. Even though the market itself was hardly in the clear, the strategy of buying only when stocks rose above their 10-month moving average kept you mercifully clear of danger throughout the 90% market wipeout.
1937
The ROC hit 45 in January 1936, but according to the rules you would have waited until the market dropped below your exit trigger which, as the chart shows, rose steadily through to March 1937 when you would have exited near the top.
From now on the timing strategy was inactive and you'd have looked for the market to display either extreme strength or extreme weakness to reactivate it.
It crossed above the 10-month moving avg in July 1937, but since it had not yet pushed above the March high (which would have demonstrated great strength) the crossover was not a buy signal. The market then collapsed spectacularly until, in October, the ROC dropped below -20 and the all-clear was sounded.
Again, the all-clear in itself does not prompt a re-entry into the market, but resets the strategy to operate normally from that point on - ie. you are now waiting for a monthly close above the 10-month moving average to reinvest in stocks. In the above example, the buy signal finally occured in June 1938.
1983
The October 1983 exit trigger broke during November, at which point you would have sold immediately. The strategy was now inactive and you awaited the all-clear: a 17% correction completed in July 1984, but the ROC remained well above -20. The market was showing great resilience and bounced back the following month, crossing above its 10-month moving average.
However, as you had not yet received the all-clear, that crossover was not a buy signal. The market could have broken down again but instead tracked sideways and, in January 1985, finally surged above its previous highs. Incidentally, it's important to note that Jan '85 closed above the high of Nov '83, it didn't just poke its head higher for a day or two. This condition establishes the true strength of the market.
The all-clear now sounded, a buy signal was simultaneously given with the Dow's close above its 10-month MA. You now bought into a market showing enormous strength, ready to set off on the greatest bull market charge in history.
WHERE WE STAND IN AUGUST 2010
Now that we're familiar with the rules of the game, where are we today? Let's look at the monthly chart.
 |
| Long Term Investment Strategy today - out of stocks, awaiting the ALL-CLEAR |
A two-month low in January 2010 was broken on February 4th. At that point, according to the rules you would have sold your positions. The market recovered into April but May was brutal and wiped out any gains you would have made staying invested.
The Dow dropped almost 15% then rebounded during July, marking a cross above its 10-month moving average. However having sold your positions, the timing strategy now becomes inactive until the all-clear is given: only a drop below -20 on the ROC indicator or a monthly close above the Dow high at 11,258 will reactivate it.
Until that time this strategy suggests you should remain in cash or safe alternative investments.
CONCLUSION
If you have not already sold, the above precedents make clear once again the perilousness of our current situation. Stocks may ultimately break higher, but meanwhile risks are skewed dramatically to the downside, making any bet on a recovery at this point utterly foolhardy.
Here we have a strategy which will get you back in the market as soon as stocks have proved they have the strength required to push higher. By closing above its April high at 11,258, the market will have determined that a 'double-dip' recession either won't happen at all, or will be brief and mild. This is the only positive sign you should be looking out for as a longer term investor.
Otherwise, the market will break down more strongly as recession bites, eventually giving you a technical sign of downside price exhaustion - which these precedents suggest is the Rate Of Change hitting -20. At that point the extreme overbought condition of the market will have been at least temporarily relieved making it wise to begin once again looking for a re-entry point - a close above the 10-month moving average.
__________o0o_________